
The answer
The short answer
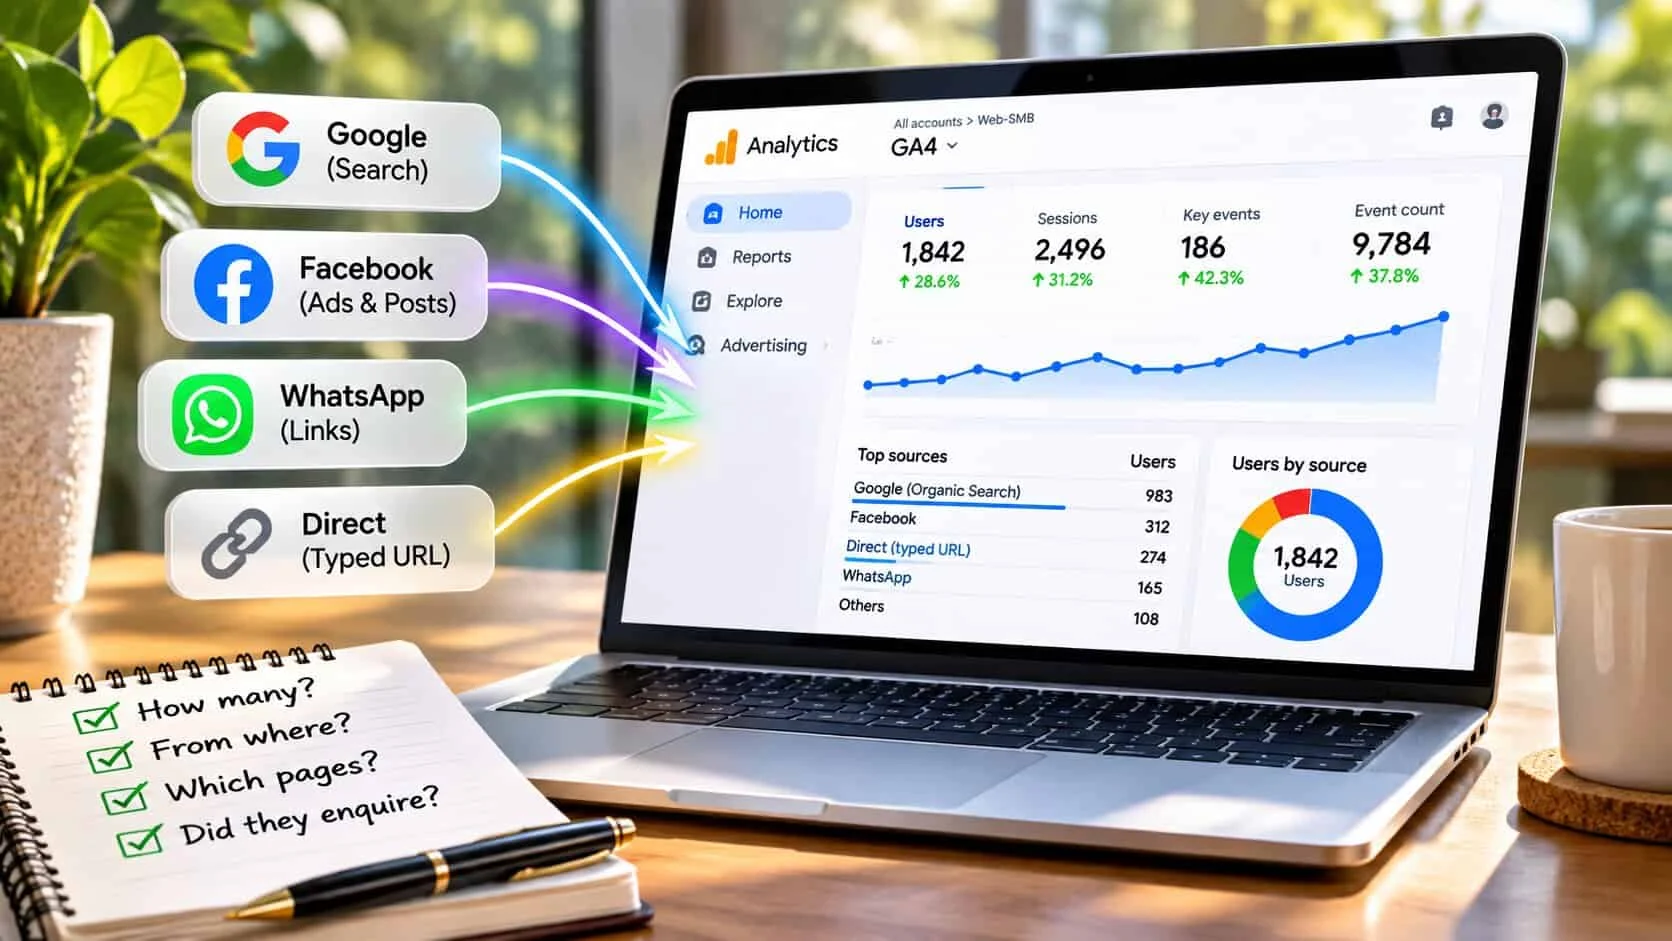
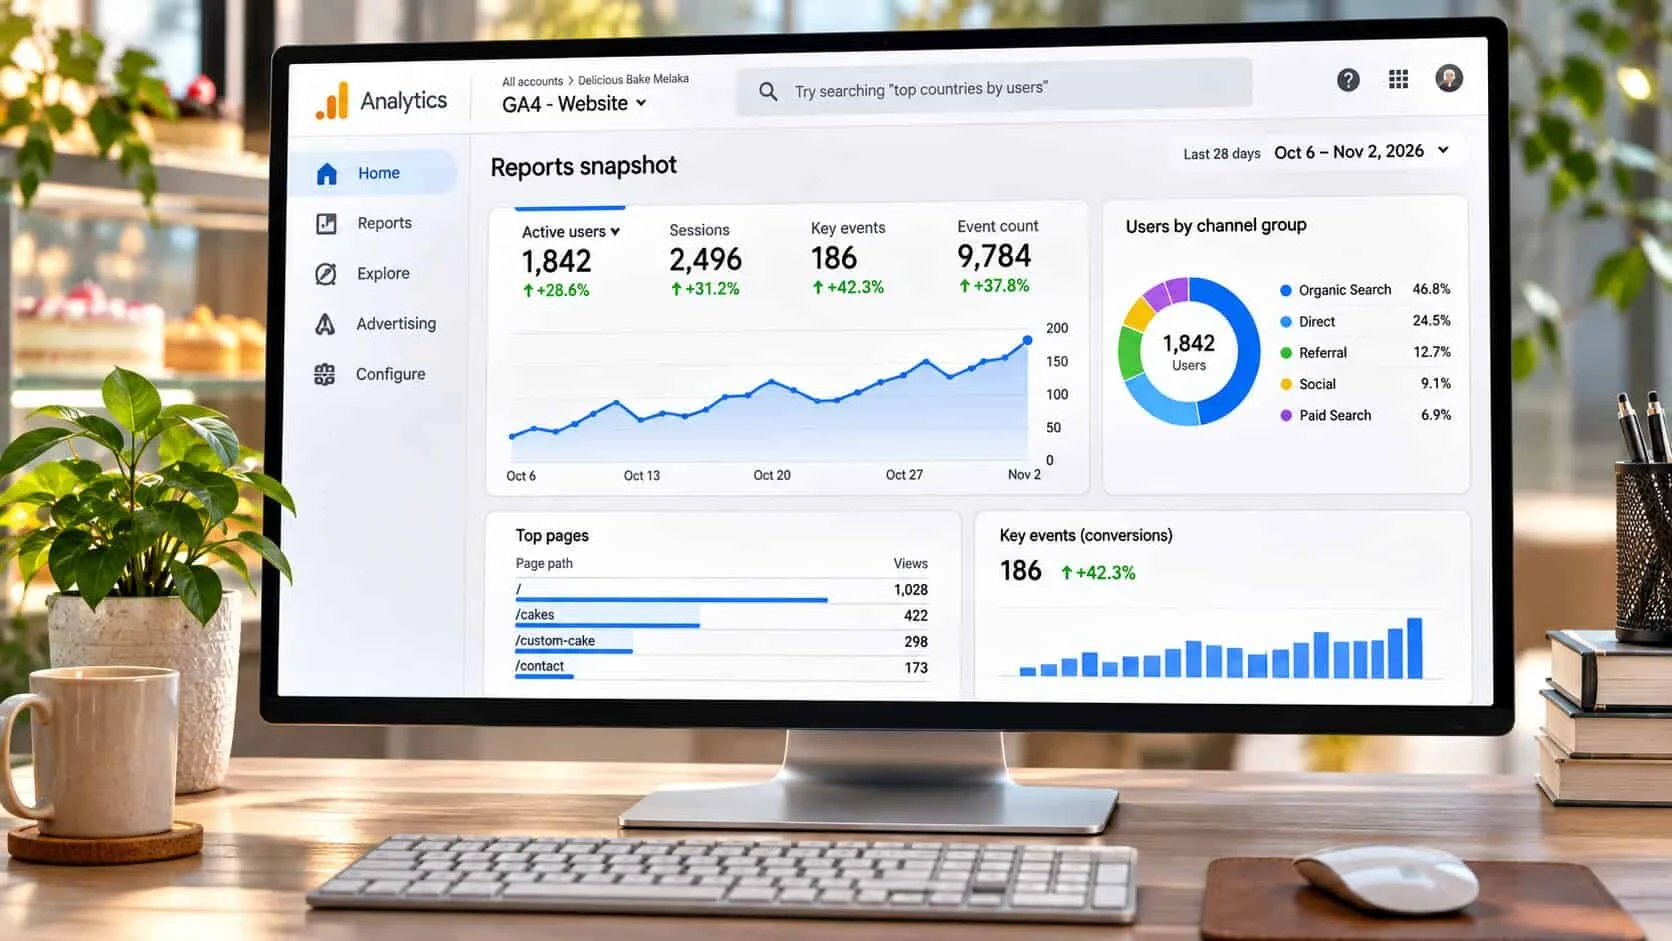
Google Analytics is a free tool from Google that records what people do on your website: how many come, where from, which pages they read, and whether they get in touch. The current version is called Google Analytics 4, or GA4.
It is not the same as Search Console. Search Console shows what happens on Google before anyone clicks. Analytics shows what happens after they arrive, from every source — Google, Facebook, WhatsApp links, ads and people typing your address.
One question matters more than the rest: which sources bring people who enquire? Everything below is built to answer it.
The numbers
The 5 numbers to check each month
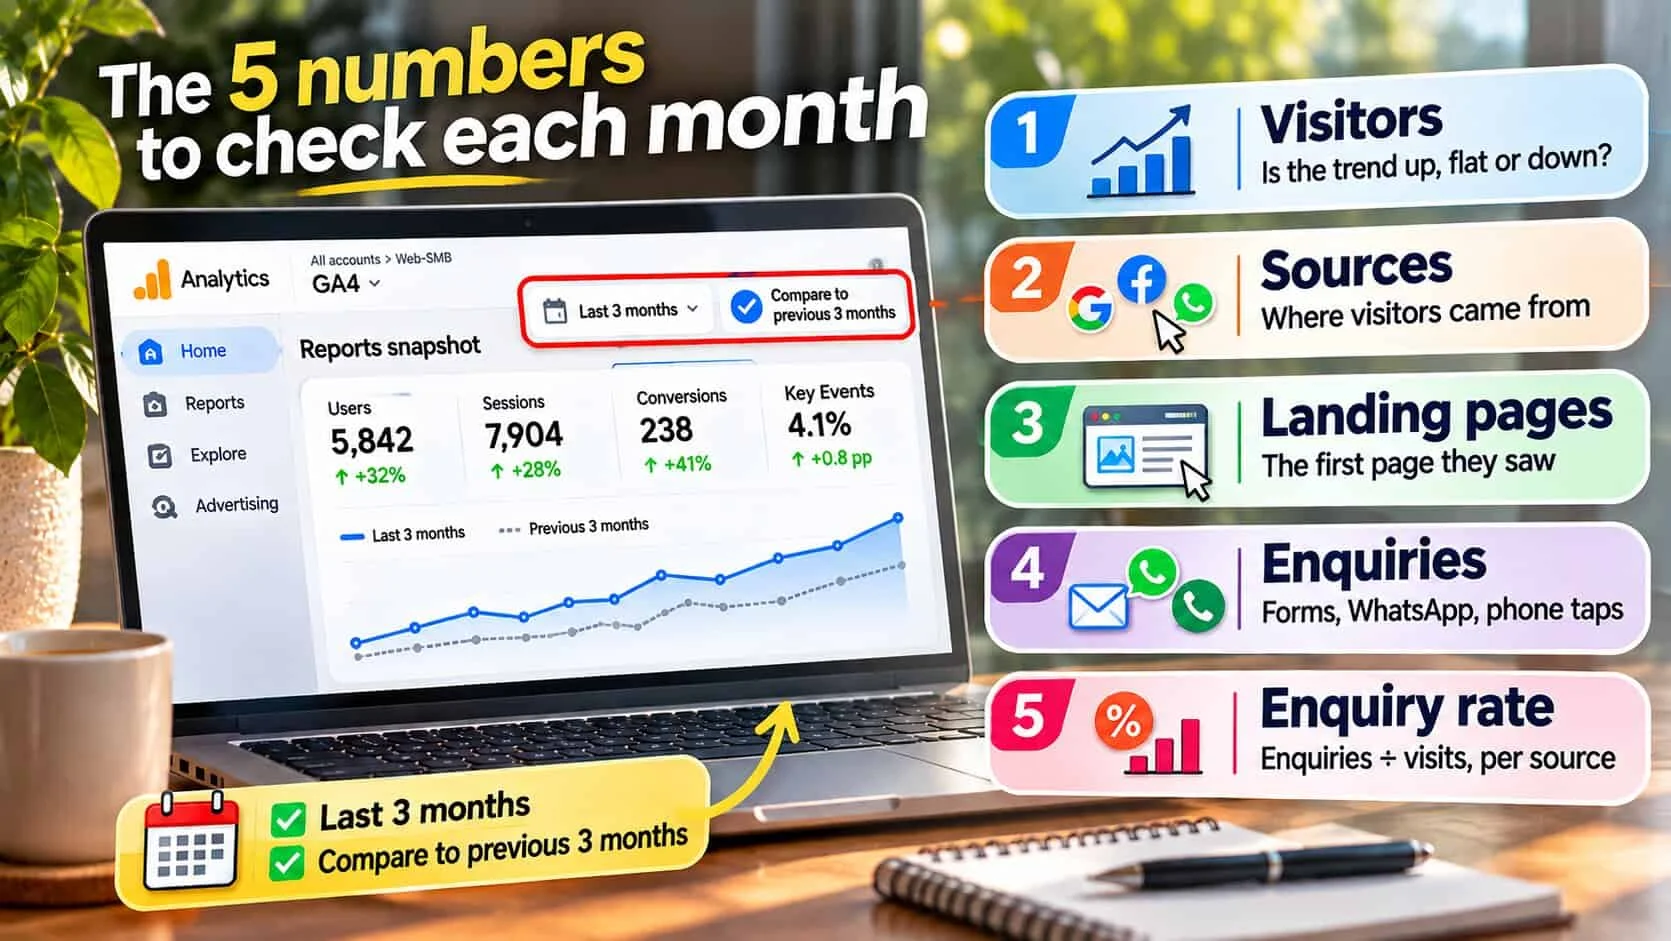
Set the date range to the last 3 months and tick Compare to the 3 months before. Then read these five, in this order:
- 1
Visitors: read the trend, not the number
In Reports → Reports snapshot, look at Active users against the previous 3 months. Up or flat is fine. Down by a third or more is worth a look. The number itself means little on its own — 300 a month can be plenty for a local service business.
- 2
Sources: where people came from
Open Reports → Acquisition → Traffic acquisition. It splits visits into groups such as Organic Search (Google), Direct (typed or saved), Organic Social (Facebook, Instagram), Referral (other websites) and Paid. Most small business sites get more than half from Organic Search and Direct.
- 3
Landing pages: the first page they saw
Open Reports → Engagement → Landing page. This shows where people enter. If a service page brings lots of visits but no enquiries, that page needs a clearer next step — see calls to action that get clicked.
- 4
Enquiries: your key events
In Traffic acquisition, the Key events column counts the actions you marked as important: form sends, WhatsApp clicks, phone taps. If this column is empty or shows zero, Analytics is not counting enquiries yet. Fix that first — the next section shows how.
- 5
Enquiry rate: which source is worth your time
Divide key events by sessions for each source. Analytics shows this as Session key event rate. A source with fewer visits but a higher rate is usually the better one to grow. This is the number that tells you where to spend next month.
The setup
Track enquiries first, or nothing else matters
Out of the box, GA4 counts page views, scrolls and some clicks. It does not know which of those are enquiries. You tell it by marking them as key events (Google called these “conversions” until 2024). This is a one-off job, about an hour for whoever looks after your site.
- 1
List your enquiry actions
Usually three: the contact form is sent, the WhatsApp button is tapped, the phone number is tapped. Add “booking made” or “order placed” if you take them online.
- 2
Make each one send an event
The form should send an event when it is successfully sent — for example, when the thank-you page loads. WhatsApp and phone taps can be tracked as clicks on links starting with
wa.meandtel:. Avoid counting every click on the form as an enquiry. - 3
Mark them as key events
In Admin → Data display → Events, find each event and switch on Mark as key event. New events can take a day to appear.
- 4
Test it yourself
Send yourself a real enquiry, tap WhatsApp on your phone, then check Reports → Realtime. If your test does not show up, it is not being counted.
While you are in Admin, also go to Data collection and modification → Data retention and change it from 2 months to 14 months. It is one click, and the default throws away detail you may want later.
The example
A worked example: a bakery’s 3 months
An illustrative Melaka bakery — the same one used in the Search Console guide. Key events are form sends, WhatsApp taps and phone taps.
| Source | Sessions | Enquiries | Rate | Verdict |
|---|---|---|---|---|
| Bring enquiries | ||||
| Organic Search | 430 | 17 | 4.0% | Grow this |
| Direct | 310 | 9 | 2.9% | Healthy |
| Busy but quiet | ||||
| Organic Social | 520 | 6 | 1.2% | Fix the landing page |
| Referral | 60 | 2 | 3.3% | Small, fine |
| Ignore | ||||
| Unassigned | 40 | 0 | 0% | Noise |
| Total | 1,360 | 34 | 2.5% | |
Illustrative numbers, labelled as such. Organic Search sessions (430) sit slightly above the bakery’s 412 Search Console clicks, which is normal — the two tools count differently.
How I would read it: Facebook and Instagram bring the most visits, but Google visitors are three times more likely to enquire. Most social visits land on the gallery page, which has no order button. Two changes for next month: add an “Order a custom cake” button to the gallery, and keep adding answer pages that Google can send people to.
Want to see what a bakery site with clear order buttons looks like? See the bakery website walkthrough.
What good looks like
What good looks like after a few months
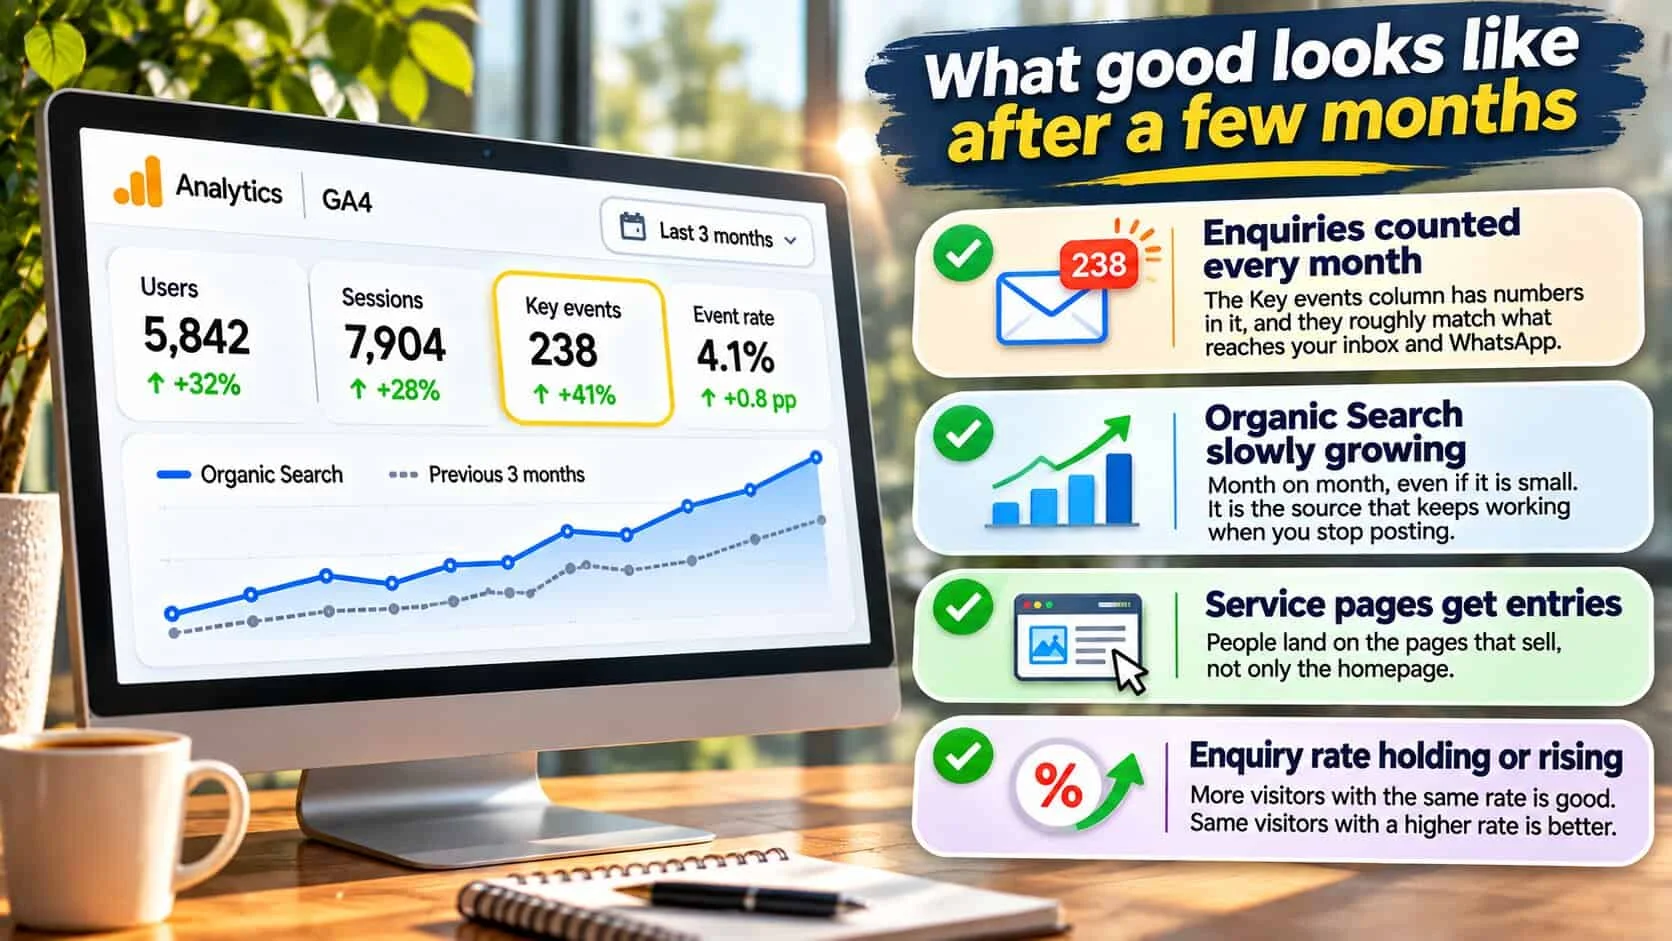
Enquiries counted every month
The Key events column has numbers in it, and they roughly match what reaches your inbox and WhatsApp.
Organic Search slowly growing
Month on month, even if it is small. It is the source that keeps working when you stop posting.
Service pages get entries
People land on the pages that sell, not only the homepage.
Enquiry rate holding or rising
More visitors with the same rate is good. Same visitors with a higher rate is better.
The warnings
When to worry, and when to wait
Most quiet months are normal. These are not — act on them the same week:
Enquiries drop to zero
Usually the form or the tracking broke after an update, not the business. Send yourself a test enquiry the same day.
A sudden spike from one country
Hundreds of visits from somewhere you don’t serve, staying 0 seconds. That is bot traffic. Read is my website traffic real?
Visitors down a third for a month
Check if a page was changed, removed or renamed, and what Search Console shows for the same weeks.
Numbers stop completely
A flat line at zero means the tracking code was removed, often during a redesign or theme change.
Analytics is one part of the monthly check. The rest — form test, phone check, renewal dates — is in keeping your website running.
Quick check: is Analytics telling you anything useful?
5 questions · 30 secondsAnswer for your own website, honestly.
Google Analytics: owners’ questions
Is Google Analytics free for a small business?
Yes. Google Analytics 4 is free. You add a small tracking code to your website once, then it records visits from every source: Google, Facebook, WhatsApp links, ads and people typing your address. The paid version is for large companies and you will not need it.
What should a small business track in Google Analytics?
Five things: how many people visit, where they come from, which pages they land on, how many enquire, and the enquiry rate for each source. Enquiries means form sends, WhatsApp clicks and phone taps, set up as key events. Most other reports can be ignored.
What is a key event in Google Analytics?
A key event is an action you have marked as important, such as a form being sent or a WhatsApp button being tapped. Google renamed conversions to key events in 2024. If you have none set up, Analytics can count visitors but not enquiries.
How often should I check Google Analytics?
Once a month is enough for most small businesses. Compare the last 3 months with the 3 months before, because single weeks jump around. Check sooner only if enquiries suddenly stop or you change the website.
What is the difference between Google Analytics and Search Console?
Search Console shows what happens on Google before someone clicks: searches, positions and clicks. Google Analytics shows what people do after they arrive on your website, from every source, including whether they enquire.